

Most business leaders keep a close eye on revenue and quota. That makes sense. But by the time those numbers start looking soft, the quarter is usually already slipping away.
In our work with B2B companies, we’ve noticed a clear pattern: the leaders who consistently hit their numbers don’t just watch the final score. They track a small handful of metrics that show them where the system is healthy and where risk is building, long before the forecast turns red.
Here are the seven sales metrics every business leader must track if they want better visibility and fewer end-of-quarter surprises.
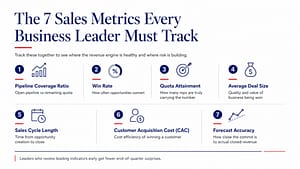
1. Pipeline Coverage Ratio
This is the one we look at first with almost every client. Pipeline coverage tells you how much open opportunity value you have relative to the remaining quota. Most solid teams sit somewhere between 3x and 5x, depending on their win rates and sales cycle.
When coverage is thin, hope becomes the strategy. Weekly tracking by stage and segment gives you time to act instead of just hoping deals magically appear.
2. Win Rate
Win rate shows how often your team actually converts opportunities into closed revenue. A healthy mid-market range often sits around 20–30%, but the absolute number matters less than the trend and the breakdowns.
We regularly see teams with decent overall win rates that drop sharply in certain segments or sources. That’s usually a qualification or messaging issue hiding in plain sight.
Quick Read – This Is How Success Vitamin Is Driving Sales Excellence with Power Advisory
3. Quota Attainment
This is the scoreboard. But looking only at the team average can be misleading. What matters more is the distribution, how many people are actually carrying the number.
When two or three reps are doing most of the heavy lifting, the system is fragile. Consistent attainment across a larger portion of the team is a much healthier sign.
4. Average Deal Size
Average deal size (or ACV) reveals whether the team is selling the right kind of business. A steady or rising number usually means better qualification and stronger value conversations. A shrinking number often points to discounting pressure or a slide toward smaller, easier deals.
Pair this with the win rate and you get a much clearer picture of commercial health.
5. Sales Cycle Length
How long does it take from opportunity creation to close? Longer cycles create more chances for deals to stall or get deprioritized by the buyer.
Top teams actively manage this number. They improve discovery, multi-thread earlier, and remove internal bottlenecks. Tracking cycle length by segment often highlights where process changes will create the biggest lift.
Suggested Read – When Hiring Sales Talent for Long Sales Cycles: What Actually Works in 2026
6. Customer Acquisition Cost (CAC)
CAC connects sales activity to unit economics. When the cost of winning a customer keeps rising while deal size stays flat, growth becomes inefficient.
Leaders should also watch the payback period and the relationship between CAC and customer lifetime value. These numbers help answer a simple but important question: Is our sales motion still efficient?
7. Forecast Accuracy
This one builds or destroys trust with the rest of the leadership team.
How close is the committed forecast to what actually closed?
Chronic over-forecasting usually means dirty pipeline data or overly optimistic stage definitions. Improving accuracy almost always starts with better deal reviews and stricter pipeline hygiene.
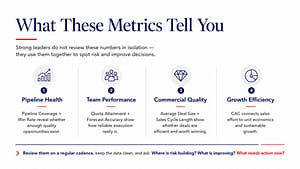
Putting It Together
Looking at any of these metrics in isolation can send you in the wrong direction. Pipeline coverage without win rate context can look healthy while the engine is quietly inefficient. Win rate without deal size or cycle length misses half the story.
The strongest leaders we work with review these seven numbers together on a regular cadence.
They ask simple questions:
Where is risk building?
What’s improving?
What needs a coaching conversation or process tweak this month?
Activity metrics still have a place for individual coaching. But at the leadership level, these seven give a much clearer view of whether the revenue engine is actually working.
Start tracking them with discipline, keep the data clean, and review them together. The difference in predictability is usually noticeable within a couple of quarters.